Debugging iOS PhoneGap Apps with Safari's Web Inspector
At some point, something will go wrong in your PhoneGap application, and you’ll want to know why. Ideally, you’ll be able to reproduce the problem in a desktop web browser, fix it, and move on. Inevitably, however, you’ll run into a problem that is only reproducible on a device. If this happens to you on iOS, and you are targetting iOS 6 or higher, you’re in luck… well, aside from that nasty defect you just found, but hey, it happens!
With Safari 6 and higher (OS X only, sorry Windows) you can use Safari’s developer tools to remotely debug web pages in mobile Safari on an iOS device.
But wait, there’s more!
Not only can you remotely debug web pages in mobile Safari, you can remotely debug any web page in any plain old UIWebView, which just happens to include that UIWebView hosting your PhoneGap application. Note that you can only inspect UIWebView content in apps that were transferred to a device from XCode. Sorry, no inspecting apps downloaded from the App Store!
Here’s how to set up for debugging PhoneGap apps with Safari’s web inspector.
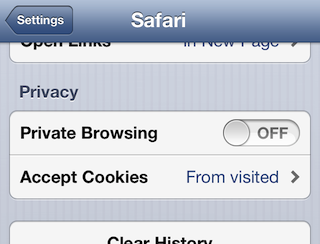
Disable Private Browsing
Open your device’s Safari settings and ensure that Private Browsing is turned off. Remote debugging will not work if Private Browsing is enabled. I learned this the hard way after wasting a couple hours trying to set up remote debugging.
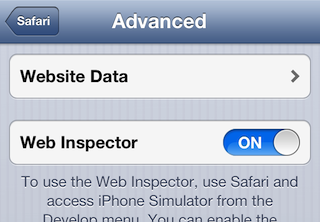
Enable Web Inspector
Tap the Advanced tab on your device’s Safari settings and ensure that Web Inspector is turned on.
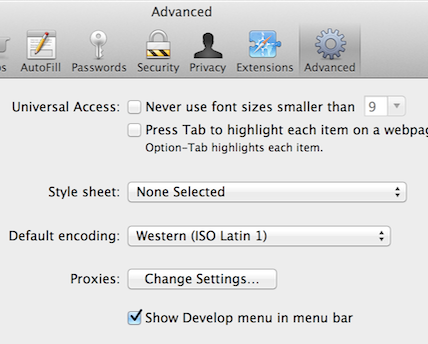
Enable Safari’s Develop Menu
On your desktop or laptop, open Safari’s Preferences and click on the Advanced tab. Check the box to Show Develop menu in menu bar.
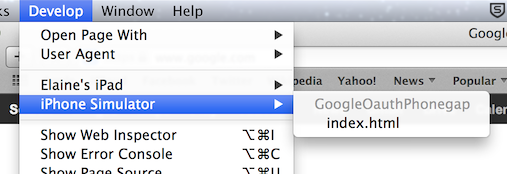
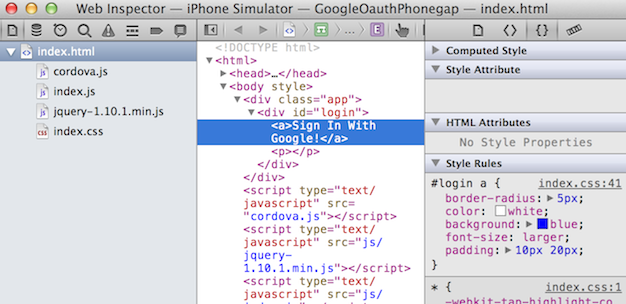
Start Web Inspector
Launch your app either in the iOS simulator or on a physical device. If you are using a physical device you’ll need to connect it to your desktop or laptop with the standard USB cable. Once the app has launched, switch to Safari, select the Develop menu item, then find the entry corresponding to the web page you want to debug.
Now you can use web inspector just like you would to debug a web page.
Pitfalls
One disadvantage to using web inspector like this is that you cannot attach early enough to debug issues that occur at start up. You can fake it a little by adding a delay to your start up code with setTimeout, but even that won’t help catch every issue. You’ll have to rely on the old standbys alert() and console.log() to figure out these issues, and of course, just opening your app’s main HTML page in a browser can be quite helpful for diagnosing start up problems.